
Inflation is heating up... The Consumer Price Index (the "CPI") – a widely accepted measure of inflation – has been increasing at about 2% annually for the past few years. The Fed has been using that slow rate of inflation to justify keeping short-term interest rates low and pumping billions of dollars into the markets every month. But as you can see from the following chart, even a small annual increase in the CPI can add up to a big move over time...
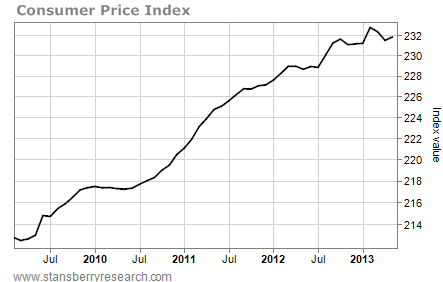
We don't really feel the pain as prices increase slowly. We're like the proverbial frog in the simmering pot of water. But it looks like things are about to heat up...
Interest rates have spiked higher over the past few weeks. Rising long-term rates is an early warning sign the market is concerned about inflation. Here's an updated chart of the 30-year Treasury Bond Yield I first showed you last month...
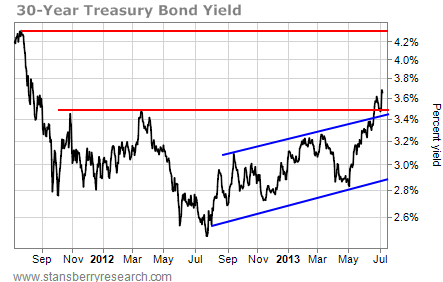
The 30-year rate has broken out above the first resistance line and is now headed toward the next resistance line near 4.4%. It's 30% higher than where it was in May. And it's up 50% from its bottom last August. Rates don't rise like this if the market is comfortable with inflation.
Now take a look at this chart of the Baltic Dry Index (the "BDI")...
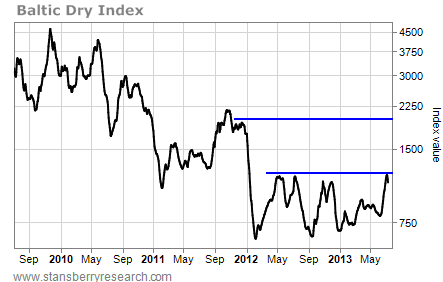
The BDI reflects the cost of shipping dry goods overseas. It's a good measure of economic activity. But it's an even better measure of pent-up inflationary pressures. The cost of shipping dry goods gets worked into the final cost of those commodities. After a three-year downtrend, the chart is poised to reverse to the upside. The BDI has already rallied more than 50% so far in 2013. If it can break above resistance at about 1,200, it will be poised to make a run at the next resistance level near 2,000. That will be one heck of a move for the BDI. And it will be a sure sign that inflation is heating up. – Jeff Clark
No comments:
Post a Comment