
Image source: The Motley Fool.
Legg Mason Inc (NYSE:LM)Q3 2019 Earnings Conference CallFeb. 04, 2019, 5:00 p.m. ET
Contents: Prepared Remarks Questions and Answers Call Participants Prepared Remarks:
Operator
Hello, and welcome to the Legg Mason Third Fiscal Quarter 2019 Earnings Call. My name is Michelle, and I will be your operator for today's conference. At this time, all participants are in a listen-only. A brief question-and-answer session will follow the formal presentation. (Operator Instructions) Please note that this conference is being recorded.
It is now my pleasure to introduce your host, Alan Magleby, Head of Investor Relations. Thank you Mr. Magleby, you may begin.
Alan Magleby -- Head of Investor Relations
Thank you, Michelle. On behalf of Legg Mason, I would like to welcome you to our conference call to discuss operating results for the fiscal 2019 third quarter ended December 31st, 2018.
This presentation may contain forward-looking statements within the meaning of the Private Securities Litigation Reform Act of 1995. These forward-looking statements are not statements of facts or guarantees of future performance and are subject to risks, uncertainties and other factors that may cause actual results to differ materially from those discussed in the statements. For a discussion of these risks and uncertainties, please see Risk Factors and Management's Discussion and Analysis of Financial Condition and Results of Operations in the company's annual report on Form 10-K for the fiscal year ended March 31st, 2018, and in the company's subsequent filings with the Securities and Exchange Commission.
During today's call, we may also discuss non-GAAP financial information. Reconciliations of the non-GAAP financial information to the comparable GAAP financial information can be found in the press release that we issued this afternoon which is available in the Investor Relations section of our website. The company undertakes no obligation to update the information contained in this presentation to reflect subsequently occurring events or circumstances.
Today's call will include remarks from Mr. Joe Sullivan, Legg Mason's Chairman and CEO; and Mr. Pete Nachtwey, Legg Mason's CFO, who will discuss our financial results. In addition, following a review of the company's quarter, we will then open the call to Q&A.
Now I would like to turn this call over to Mr. Joe Sullivan. Joe?
Joseph A. Sullivan -- Chairman and Chief Executive Officer
Thanks, Al. Good evening, and thank you for joining us. We appreciate your continued interest in Legg Mason. With me tonight as always is Pete Nachtwey, our CFO. These are certainly turbulent times, shifting dynamics in foreign relations and global trade policies, the political stalemates of another possible US government shutdown, varying potential Brexit outcomes and evolving monetary policy. The list of major market drivers is certainly long and the result is rising market volatility and increasing investor uncertainty.
Against this backdrop, we firmly believe that active management should always play a critical role in portfolios and now even more so during times of market turbulence. At the core of this belief is the value of thoughtful diversification be at across a portfolio of securities or funds or a portfolio of investment managers, such diversification can mitigate risk and volatility and ultimately enhance returns over time. And we believe this quarter highlighted many of the benefits that diversification brings to Legg Mason.
Now as you all know the S&P 500 Index suffered its second worst December on record declining just over 9%. And for the quarter, the S&P 500 was down 14% and the Russell 2000 was down over 20%. But in contrast, the Barclays Agg finished up 1.6%, reflecting a somewhat late but distinct modification in tone from the Fed and a change in the expectation of future rate hikes. During this time, fourth quarter industry flow metrics were extremely weak in the US with $313 billion of net outflows from US active mutual funds, the largest ever on record.
And just for the sake of comparison, at the height of the financial crisis in 2008, outflows were two-thirds of that number at $195 billion. Yet, Legg Mason's total AUM declined less than 4% for the quarter, reinforcing the benefit of our diversification across asset classes, distribution channels, geographies and affiliates.
Moving on to our retail distribution platform, perhaps somewhat counter intuitively in the midst of such a challenging market environment, our gross sales were up quarter-over-quarter and we achieved modest market share gains, as some of our distribution partners continued to rationalize managers and reallocate assets amid the market's volatility.
We also benefited from our channel and geographic diversification. We continue to see retail channel momentum with positive net sales in Australia, Japan and DCIO in the US. And the diversification of our business continues to create opportunities to grow as we begin 2019, particularly when combined with improving performance in the critical three and five year time frames. Our managers generally viewed the volatility in December as a correction that was long overdue and one that created opportunities for investment out performance. To that point, ClearBridge and Royce saw strong improvements in performance as market leadership and sectors shifted and broadened.
More recently, Western's performance has also improved, as their macro call on slow and steady global growth, very modest inflation, gradual rate increases and opportunity in the emerging markets seems to be playing out. Client interest and activity in terms of searches and RFPs has increased during this volatile period, reflecting the breadth and diversity of our investment strategies and vehicles. Against a backdrop of significant active equity outflows, seven strategies that ClearBridge generated net inflows for the quarter led by international strategies.
EnTrustPermal's coinvestment and direct lending businesses continue to gain traction and Clarion was again in net inflows for the quarter, the seventh consecutive positive net flow quarter. Further, we continue to believe significant growth opportunity exists in the customized investments solution space, where we are investing QS and in technology that will enable greater connectivity between the proprietary asset allocation tools of QS and the entire Legg Mason and affiliate organization. We expect this investment will enhance our solutions capabilities and our ability to leverage our affiliates to provide more comprehensive and customized solutions for our clients.
Our diversification by vehicle also continues to create opportunity for us. CIT vehicles long used to serve the retirement market are increasingly attractive to public pensions that need the reporting attributes of a commingled vehicle and which value their transparency and cost efficiency.
Martin Currie, recently seeded an emerging market equity strategy CIT with $400 million from an existing pension client, who wanted a better solution to access emerging market equities. This new CIT is in addition to the strategies existing mutual fund and SMA structures providing an expanding suite of emerging market vehicles. And staying with the vehicle theme, we are pleased to have launched the first active fixed income ETF in Australia in partnership with Western and BetaShares. Investors in Australia are broadly under allocated to fixed income, and this ETF gives retail investor there easier access to new income possibilities via the Australian Securities Exchange. Clearly, the quarter was difficult but we certainly continue to make substantial progress on a variety of fronts.
And now I'd like to share an important update on the next steps in our collaborative efforts. For some time, we have highlighted the evolving needs and expectations of clients and how Legg Mason broadly has embraced a fresh enterprisewide mindset of collaboration to transform the way we operate and serve clients. We deeply value our independent investment expertise and we recognize the need and opportunity to deliver even better results for clients by increasingly leveraging the breadth and scale of the enterprise. We have previously mentioned how we began our collaborative work in the areas of procurement and the creation of a consolidated financial platform, both of which are well under way.
Through this insight -- through the insight and the confidence gained from these ongoing collaborations, we are now prepared to take a bolder step forward with the creation of a new global operating platform which will make us even more effective. This platform will capitalize on our combined operational scale and the related synergies across operations, technology, fund administration, finance, real estate, human resources, legal and compliance, enterprise risk management and other corporate services at Legg Mason and certain of our affiliates. The platform in our view will enhance services to both internal and external clients, expand business investment capital, create a framework for innovation and increase profitability, which will benefit all stakeholders.
Specific cost savings initiatives include, consolidated financial and benefits systems, technology sharing across the enterprise and the elimination of duplicative support services. We will be able to better leverage specific affiliate proficiencies around the globe. And let me share some examples of that with you. Across Legg Mason, we are undertaking technology innovation initiatives on a modest scale from robotic technology to streamline accounts payable and AI that accelerates response times for cyber threats, to predictive analytics that anticipate advisor needs by combining flow, sales and marketing data and machine learning to enhance product commentary. All of this and more can make us more nimble, more efficient, more effective and more responsive to clients, if we scale them across our businesses.
Now to be clear, we are not just making short term cost cuts in response to a challenging market, rather, we are creating permanent structural changes that will result in greater effectiveness and enduring efficiencies. As we build this new business platform, we expect to realize $90 million to $110 million in annual savings, creating synergies that will free up capital to improve our operating margin and ultimately allow us more flexibility to invest in growth. And finally, we project implementation costs associated with these synergies to be between $130 million and $150 million. Now that we've made our plans public, we'll be able to work internally with greater transparency to better refine the timing of savings and the related costs which we will continue to share with you beginning next quarter.
I want to emphasize that as our clients preferences evolve and the industry continues to change, we will continue to innovate around the multi-affiliate model, as we increasingly come together when and if it makes sense for our clients, shareholders and employees while preserving the hallmark of Legg Mason, the independence of our investment expertise. We intend to stay laser focused on the development of this platform as we make ongoing progress in leveraging our scale and becoming increasingly efficient, all of which is focused on serving clients better and building a foundation of sustainable growth and profitability.
And with that, let me turn it over to Pete.
Peter H. Nachtwey -- Chief Financial Officer
Thanks, Joe. Let's turn to our highlights on slide two. Legg Mason reported a net loss of $217 million or $2.55 per share driven by non-cash intangible asset impairment charges of $365 million as well as certain tax items in global operating platform development costs. These combined to reduce earnings by $3.28 per share.
As Joe noted, we're developing a new, more efficient global operating platform that will lead to $90 million to $110 million in annual savings, 85% of those savings we see being achieved over the next 24 to 36 months with the majority of those saves realized by the end of fiscal '21. The remaining 15% of the savings are related to real estate which will take a bit longer to fully realize. It's important to note that we will also incur episodic implementation costs to achieve these savings which going forward, we currently estimate to be in $130 million to $150 million range.
Moving onto AUM, our quarter-end assets under management were $727 billion, with long-term net outflows in the quarter of $8.5 billion coming from fixed income at $5.1 billion, equity at 3.3 and alternatives at $100 million. Our global distribution platform reported a slight increase in gross sales from the prior quarter. But consistent with industry trends, we saw a pick up in redemption rates that caused our net sales to become more negative. As for investment performance, 80% and 73% of AUM beat benchmarks for the three and five year periods, while 69% and 71% of AUM beat Lipper category averages for the three and five year periods respectively.
From a capital management standpoint, we paid $30 million of dividends in the quarter. And on the recognition front, Legg Mason and our three largest investment affiliates were once again named Best Places to Work in Investment Management P&I Magazine. Legg Mason was also ranked number three among capital markets companies, and then in the top quintile overall in the Forbes, JUST Capital Rankings. And finally, Western asset is sub-advising first active fixed income ETF in Australia, which as Joe mentioned, launched in early November.
Now let's take a look at our affiliates on slide three. As previously noted, our long-term net outflows in the quarter were $8.5 billion driven by fixed income and equities. Thanks to our asset -- diverse affiliate mix, AUM for the quarter was down just 4%. And you can see at the bottom of the chart that both large and small cap equity indices were down dramatically, while fixed income and real estate industries -- indices were positive which helped to stabilize our AUM versus peers in a highly volatile quarter for the equity markets. Despite the challenging market backdrop last quarter, Western and Clarion saw positive AUM growth. Western's was driven by over $10 billion in liquidity inflows, while Clarion had $900 million in positive real estate AUM flows in the quarter. Unfunded wins and committed but uncalled capital were down slightly from the prior quarter, primarily reflecting fundings, particularly in the month of October. FQ3 is seasonally our lowest quarter for unfunded wins and committed on call capital, but despite that historical fact, this quarter was our third highest quarter ever on record.
Turning to slide four, you can see that the mix of our unfunded wins and committed uncalled capital remains diverse with a little over 60% in fixed income and roughly 20% each for equities and alternatives. The $6.4 billion of unfunded wins and fixed income are spread across multiple flagship strategies and a similar diversification story holds true for the $2.3 billion of equities. Finally regarding alternatives, we are very pleased that our unfunded wins and committed uncalled capital remain strong at a combined $5.1 billion, with EnTrustPermal being the major contributor.
Slide five highlights our global distribution platform. As I mentioned earlier, negative net sales for the quarter were driven by pickup and redemptions consistent with industry trends. While as Joe noted, gross sales were slightly higher than the prior quarter. The pickup and redemption's reflected both the volatility in the markets during the quarter, as well as seasonal tax law selling at the end of the calendar year.
In terms of financial highlights on slide six, you'll note the combined impact of non-cash impairment charges, certain tax items and global operating platform development costs, reduced earnings per share by $3.28. Operating revenues decreased by $54 million or 7%, driven by lower average AUM as well as a $17 million decrease in pass through. Non-pass through performance fees were little over $5 million at the low end of the forecasted range for the quarter. We estimate the next quarters' NPT fees should be in the range of $5 million to $10 million. Also pass through performance fees of Clarion, we estimate will add another $10 millions to our GAAP revenues.
Operating expenses increased reflecting the noncash impairments, but excluding those charges, expenses were down $47 million or 8%. Our adjusted operating margin was 21.1% for the third fiscal quarter verses 23.6% in the prior quarter. This primarily reflects lower revenues as well as the global operating platform costs. In addition, our GAAP gap tax rate came in at 23%, reflecting the impact of noncash impairment charges and the other discrete tax items in the quarter. Looking forward, we expect our effective tax rate for FQ4 to come in at 27%. And our cash tax rate, excluding the noncash impairment charge was 7% for the quarter, a rate we expect will hold for the remainder of fiscal '19. Looking out further, we believe cash taxes will be in the single digits until approximately fiscal 2024, which is one year later than our previous projection.
On slide seven, you can see that AUM decreased primarily due to market declines and long term outflows. The operating revenue yield came in at 37 basis points driven by mix and markets, specifically you can see that equity AUM as a percentage of total AUM dropped to 25%, while liquidity AUM increased to 10%.
Operating expenses on slide eight, increased by $318 million due to the intangible impairment charges. Excluding those charges, again expenses were down $47 million reflecting reduced AUM and operating revenues. Higher other expenses include a professional fees of $5.9 million related to our work on the global operating platform as well as higher advertising, conference and T&E expenses in the quarter. Next quarter's operating expenses will include additional global operating platform costs of $9 million to $11 million combined of approximately $3 million in occupancy expenses and $7 million in other operating expenses.
Turning to slide nine, total comp and benefits decreased by $48 million due to decreased incentive comp and lower operating revenues. This led to our comp ratio for the quarter coming in at 54% in line with our forecasted range. Next quarter, we expect our comp ratio to increase reflecting a pickup in seasonal expenses to range for 54% to 56%. We will also have two other items hitting in fiscal Q4, including a noncash charge related to the final tranche of units being issued under the Royce Management Equity Plan. As you may recall, the Royce MEP effectively equities a portion of their team's existing revenue share. So there's no change in the percentage of revenue coming to the parent, but there is a noncash gap charge. The other item relates to an affiliate downsizing program, separate from the global operating platform that was announced to those affiliates employees today. These two items will result in charges of approximately $7 million.
On slide 10, our operating margin as adjusted decreased primarily due to the drop in revenues, but also reflects $5.9 million and costs associated with the global operating platform which reduced the adjusted operating margin by 1%. We would expect next quarters margin to be lower, reflecting the impact of seasonal comp increases as well as the increase in global operating platform costs.
Finally on slide 11, you'll see a roll forward from fiscal Q2's net income of $0.82 per share to this quarter's net loss of $2.35. Last quarter's results included a discrete tax benefit offset by real estate charge and global operating platform costs which decreased earnings per share by $0.01. This quarter's results included $0.14 of lower operating earnings, reflecting reduced revenues and increased other operating expenses. Non-operating earnings were $0.04 higher as a distribution on investment holding more than offset the impact of lower mark-to-market on seed investments. And lastly, fiscal Q3 items included the noncash impairments, net tax expense items and global operating platform development costs totaling $3.28.
So thanks again for your time this evening. And I'll now turn it back over to Joe Sullivan.
Joseph A. Sullivan -- Chairman and Chief Executive Officer
Thanks, Pete. I'd like to close our formal comments this evening with a bit of perspective. As I mentioned, we have been working on achieving greater collaboration across the enterprise for quite some time. And today's announcement is not driven by short-term market conditions, but rather informed by client expectations, industry challenges and the opportunities identified and the insights achieved through our increased collaboration. It is the natural evolution of our corporate strategy over the last five years, which now focuses on further enhancing the client experience.
We are in the process of striking a better balance between the independent expertise that we and our clients deeply value, with the operating efficiency that the industry demands.
We remain committed to our mission of investing to improve the lives of our clients, our stakeholders, our employees and our communities. And we believe that the changes we are announcing today reflect the importance of our continued commitment to put our clients first to help us achieve our mission for all of our constituents.
And with that, we'll be happy to take your questions.
Questions and Answers:
Operator
Thank you. We will now begin the question-and-answer session. (Operator Instructions) The first question in the queue comes from Robert Lee with KBW. Please proceed with your question.
Robert Lee -- KBW -- Analyst
Great, thanks. Good afternoon, guys. Thanks for taking my question. I guess, why don't we star-off with the initiatives, the cost savings initiatives and the efficiency initiatives. So first question is, Joe, as part of this three multi-parts. Number one, how is the revenue sharing arrangements with the affiliates going to evolve or change because of this and it's worth thinking of -- also try and get maybe a sense of how we should think of the pattern of costs versus savings, kind of getting the impression that maybe over the next year or so will see the implementation costs flow through at least the first part of the outflow (ph) impact earnings whether maybe later on when we start to see some of the expense saves. And I know you're going to talk about a little bit more next quarter, but just trying to get some sense of how they're going the trade -- what the trade offs will be over the coming say 18 months or so?
Joseph A. Sullivan -- Chairman and Chief Executive Officer
Sure. Good questions, Rob. Thank you. Let me maybe provide a little high level perspective on this and then Pete, I'm going to ask you to jump in on the -- some of the other more technical questions if we can. I think at a high level, the way we think about this initiative is, really as a capital allocation question. We can continue to allocate capital efficiently across Legg Mason and the affiliates with significant operational redundancy or together we can choose to come together to create a better combined platform for less by leveraging our collective scale, that's what we're choosing to do it. And in the process, we will realize meaningful synergies, and then importantly, look to invest together those synergies to grow.
I think that, as a enterprise, we see, all of us see that the industry is changing and that in a period of significant margin pressure, more investment than ever is required, and things like technology or marketing or distribution and service and support. In our case, we're in a perverse kind of way, fortunate to have the ability to create that capital to invest without sacrificing other capabilities or quality by eliminating redundancy and redeploying that capital. So we can we can read a play that toward supporting clients better and then ultimately driving growth. So, we kind of see this as a capital allocation question. Pete, do you want to talk about the rev shares and then the timing? I think Rob asked about.
Peter H. Nachtwey -- Chief Financial Officer
Sure. Yeah, thanks again Rob for those questions. The simplest way to think about it from a rev share standpoint, it will
 Source: adt.com
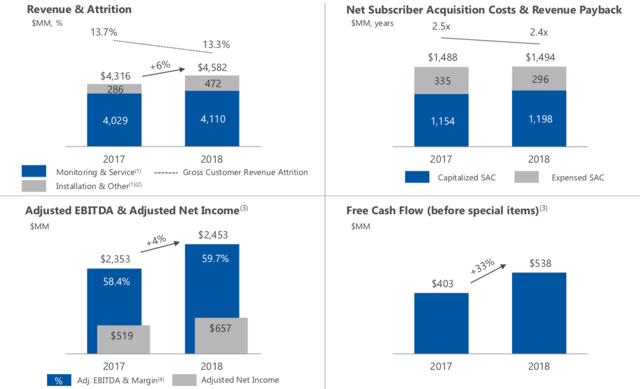 Source: ADT Q4 2018 Earnings Presentation
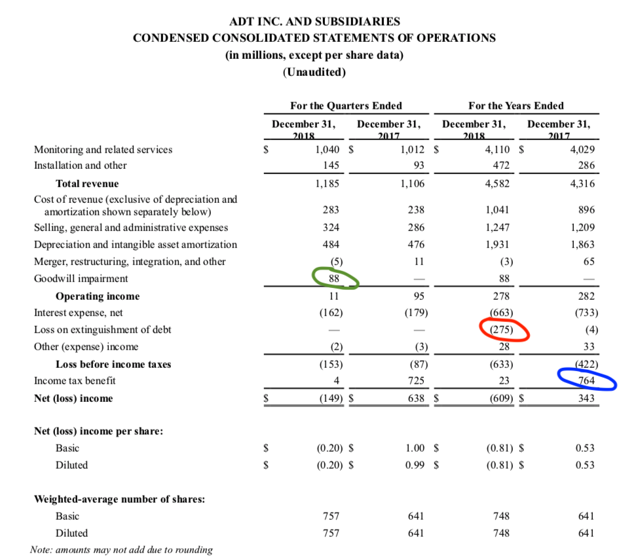 Source: ADT Q4 2018 And 2018 Full Year Earnings Release
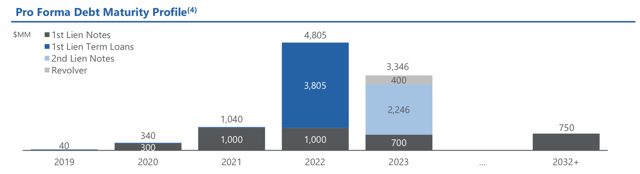 Source: ADT Q4 2018 Earnings Presentation
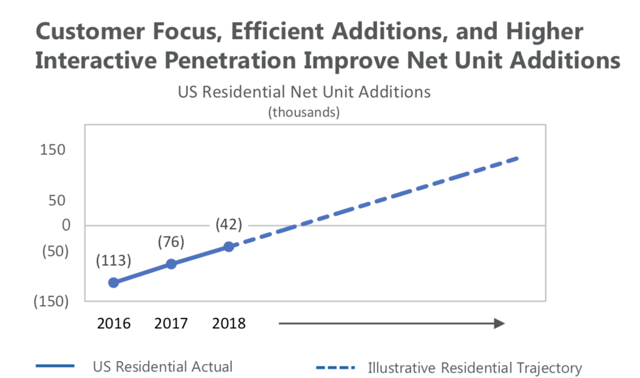 Source: ADT Q4 2018 Earnings Presentation
 Chris Johnson
 Source: Shutterstock